Commodities
Commodities: The S&P GSCI, Front-Month Futures by Group and the ETFs That Track Them
The S&P GSCI commodity benchmark with its chart, front-month futures across energy, metals and agriculture, and the exchange-traded funds that give exposure to each.
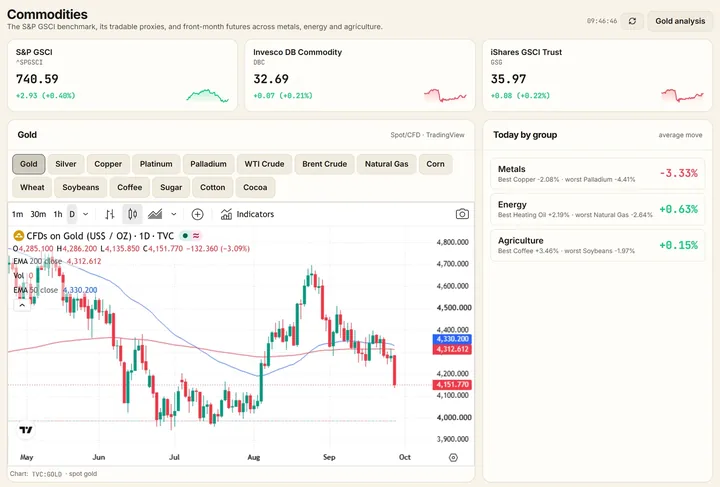
The commodities page opens with the S&P GSCI, the broad production-weighted commodity benchmark, charted over the period you choose, with the exchange-traded funds that track it or its sectors beside it, so the asset class is read as a whole before any single contract.
Beneath it, the front-month futures are grouped: energy with crude oil, Brent, natural gas and the refined products; precious metals with gold, silver, platinum and palladium; industrial metals with copper; and agriculture with the grains and softs. Each shows the day's move and the week's, and opens a symbol page with its chart.
Gold, silver, platinum, palladium, copper and the two crude benchmarks are priced from their spot markets and stream through the session, and the gold, silver, oil and natural gas notebooks apply the desk's method to the contracts that matter most.
What it shows
- The S&P GSCI benchmark, charted, with its tradable proxies
- Front-month futures across energy, precious and industrial metals and agriculture
- The day's and the week's move on every contract
- Streaming prices for the metals and the crude benchmarks
Guides that explain it
Macro and rates
What moves gold
The drivers of the gold price in order of weight: real yields, the dollar, central bank buying, ETF flows and positioning, and how the price itself is set.
4 min read
Macro and rates
The dollar index (DXY)
How the US Dollar Index is built from six currencies, its weights and history, what it leaves out, and why its moves run through gold, oil and emerging markets.
3 min read
Market structure
Sector rotation
The eleven equity sectors, what each is sensitive to, the classic rotation through the business cycle, and how relative strength shows where money is moving.
3 min read