Analysis
Market Insights: Cross-Asset Regime, Breadth, Sector Rotation and Technical Scores
A regime read across equities, rates, currencies and commodities, S&P 500 breadth, sector rotation over several windows and a technical scoreboard, all computed from price history on the server.
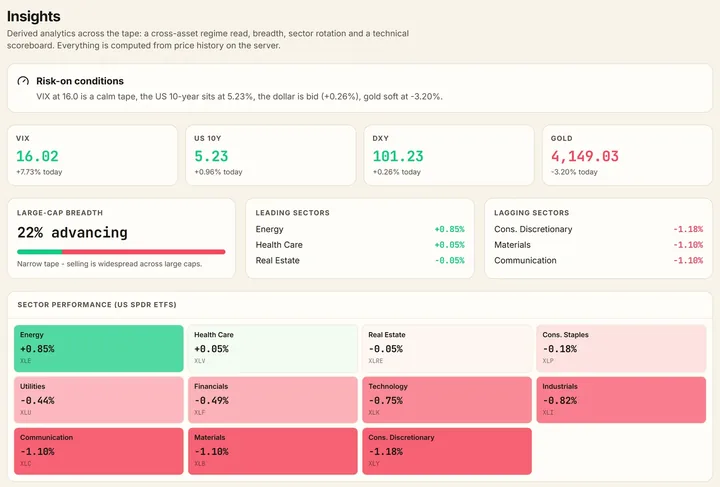
The insights page is the desk's read of the whole tape. A regime panel scores risk-on against risk-off conditions across equities, rates, currencies, commodities and volatility, from the relations that usually hold between them: equities against bonds, the dollar against commodities, high beta against low volatility, discretionary against staples.
Breadth for the S&P 500 is read from the share of members above their moving averages and from the equal-weight index against the cap-weight one, so a rally carried by a handful of names is distinguished from a broad one. The eleven sectors are ranked by return over one week, one month and three months, and the rotation between cyclicals and defensives is read from the ranking.
A technical scoreboard lists the desk's instruments with their bounded scores and the readings behind them, so the symbols that are stretched and the ones that are turning can be found in one table rather than one chart at a time. Everything on the page is computed from price history on the server and refreshed through the session.
What it shows
- A cross-asset regime read: risk-on against risk-off
- S&P 500 breadth, including equal-weight against cap-weight
- Sector rotation over one week, one month and three months
- A technical scoreboard across the desk's instruments
Guides that explain it
Market structure
Market breadth
How many stocks share in an index move: the advance-decline line, the percent above the 200-day average, breadth thrusts and divergences.
3 min read
Market structure
Sector rotation
The eleven equity sectors, what each is sensitive to, the classic rotation through the business cycle, and how relative strength shows where money is moving.
3 min read
Macro and rates
The VIX explained
How the VIX is derived from S&P 500 option prices, the rule of 16 for a daily move, what its levels and term structure mean, and how it tracks stocks.
4 min read