Features
Everything on the desk.
Twenty workspaces, one navigation, one refresh cycle. Each page below is a real page in the product, captured live, with what it shows and the guides that explain it.
20 workspaces · Equities, rates, FX, commodities, crypto
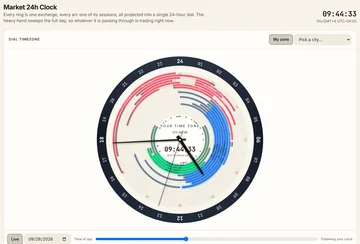
Sessions
Market 24h clock
Every exchange is a ring, every session an arc, all on one dial. The heavy hand shows what is trading right now.
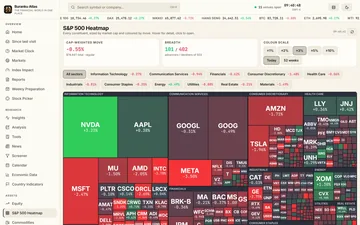
Equities
S&P 500 heatmap
Every constituent sized by market cap and coloured by its move, grouped by sector, so the shape of the day is obvious before a single number is read.
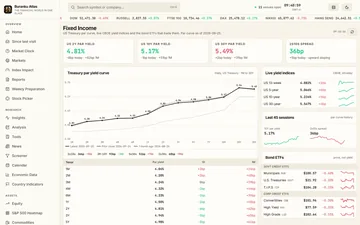
Rates
Fixed income
The US par curve against the prior close and a month ago, the spreads that matter, and the yield indices and bond ETFs that trade them.
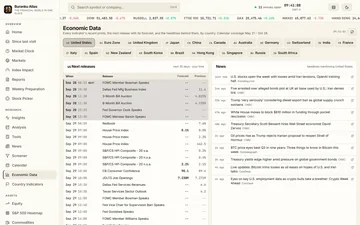
Macro
Economic data
Each indicator's recent history, the next release with its consensus and previous, and the headlines behind it, organised by country.
News
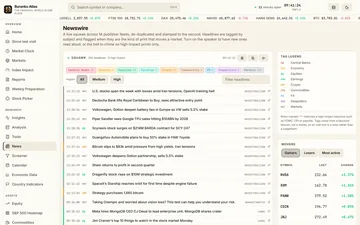
Newswire
A live wire across fourteen publisher feeds, de-duplicated and stamped to the second, tagged by subject and flagged when it is the kind of print that moves a market.
Equities
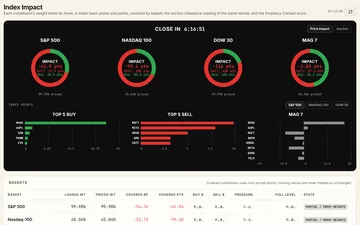
Index Impact
Every constituent's weight times its move, summed into index basis points and points, so you can see which names are carrying the index into the open.
Desk plan
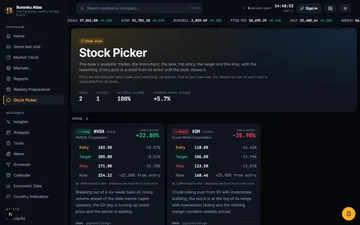
Stock PickerDesk plan
The desk's analysts publish their trades: the instrument, the side, the entry, the target and the stop, with the reasoning. Every pick is scored from its entry until the desk closes it.
Charts
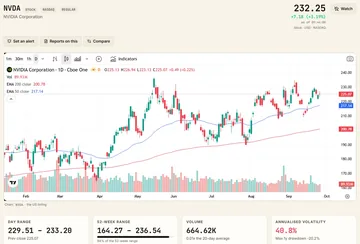
Symbol pages
Candles with moving average and Bollinger overlays, RSI and MACD panes, and a technical scoreboard for any ticker.
Analysis
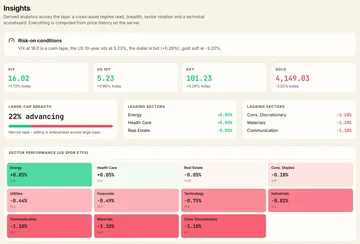
Insights
A cross-asset regime read, breadth, sector rotation and technical scores, all computed from price history on the server.
Analysis
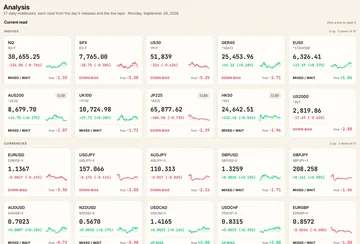
Analysis notebooks
Daily reads for gold, the US indices, oil and gas, FX pairs and equity sectors, each built from weighted releases and market checks, with a verdict and a strength gauge.
Research
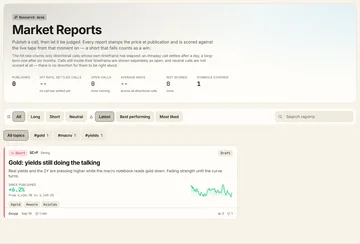
Market reports
Daily commentary from the desk. Every report stamps the price at publication and is scored against the live tape from then on.
Research
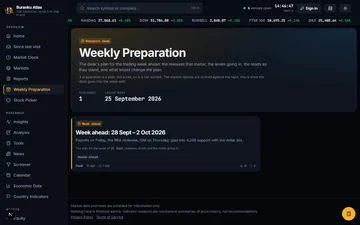
Weekly preparation
The desk's plan for the trading week ahead: the releases that matter day by day, the levels going in, the reads as they stand, and what would change the plan.
Equities
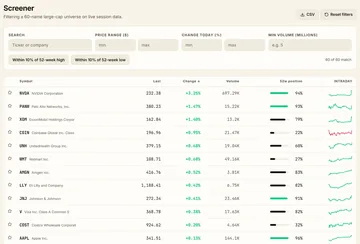
Screener
Filter a large-cap universe on live session data: change, volume, 52-week position and intraday trend. The EMA Touch boards map every asset against its EMA 50 and 200.
Macro
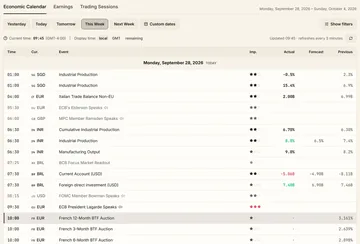
Economic calendar
The week's releases by country with importance, actual, forecast and previous, in your time zone or GMT.
Macro
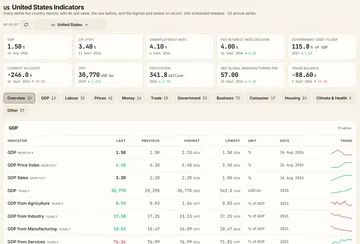
Country indicators
Every series a country reports, for 218 countries: last, previous, highest and lowest on record, back to 1960, grouped from GDP to housing.
Equities
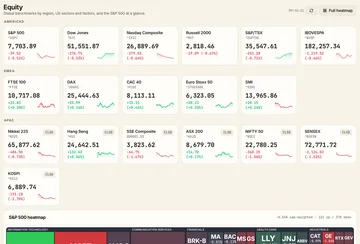
Equity
Global benchmarks by region, US sectors and factors, and the S&P 500 at a glance.
Crypto
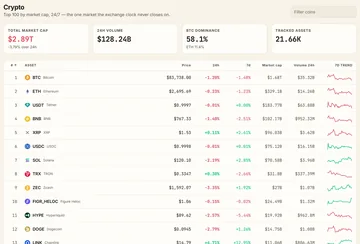
Crypto
The top hundred by market cap, around the clock, with dominance, volume and seven-day trend.
Commodities
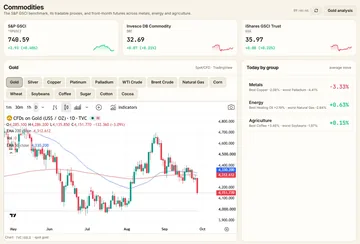
Commodities
The S&P GSCI benchmark, its tradable proxies and front-month futures across metals, energy and agriculture.
FX
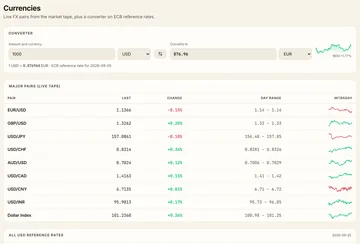
Currencies
Live FX pairs from the market tape and a converter on ECB reference rates.
Overview
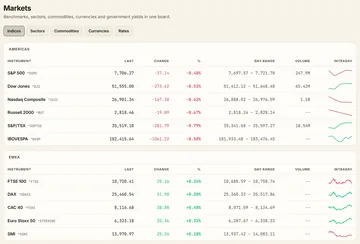
Markets board
Benchmarks, sectors, commodities, currencies and government yields in one board, by region.
Get started
Sign in with Google to look around for free.
The free plan opens every page on data as it stood a year ago. A subscription opens the live desk the moment the payment goes through, and can be cancelled at any time.