Equities
S&P 500 Heatmap: Every Stock Sized by Market Cap and Coloured by Its Move
A full-screen treemap of all 500 S&P constituents, each tile sized by market capitalisation and coloured by the day's move, grouped by sector with filters and a switchable colour scale.
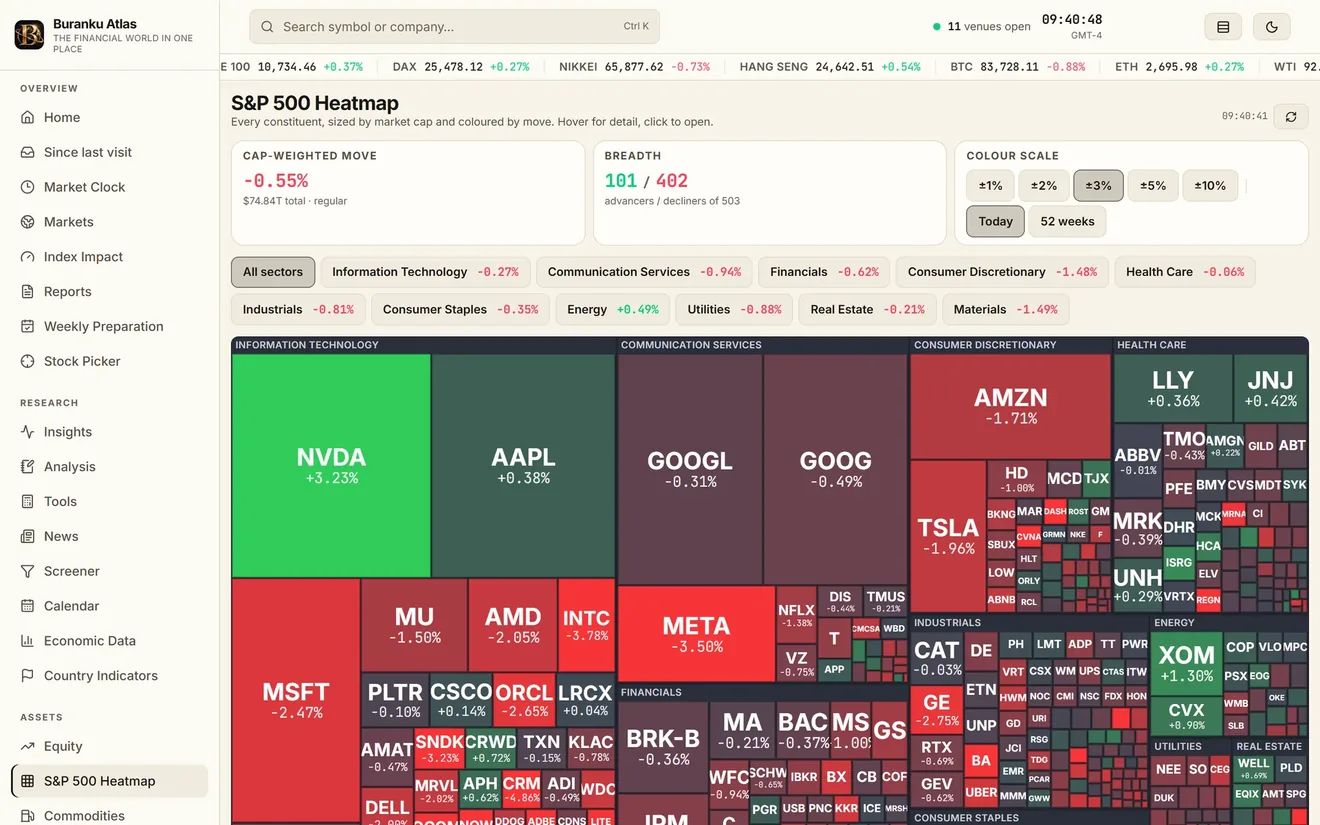
The heatmap draws the whole S&P 500 on one canvas. Every constituent is a tile, its area proportional to the company's market capitalisation and its colour set by the day's percentage move, from deep red through neutral to deep green. The tiles are grouped by sector, so a day in which technology is up and energy is down reads as two blocks of colour before any number is consulted.
The header carries the cap-weighted move of the index and its breadth, the share of constituents up on the day, which together say whether a move is broad or carried by the largest names. Sector filters isolate one group; the colour scale can be set from one to ten percent so that a quiet day and a violent one each use the full range.
Hovering a tile shows the name, the price, the move and the weight; clicking it opens the symbol page with the chart and technicals. The heatmap is refreshed through the session, and the same treemap is available for a watchlist, so a portfolio can be seen the same way.
What it shows
- All 500 constituents, sized by market cap, coloured by the day's move
- Grouped by the eleven sectors, with a filter for each
- Cap-weighted index move and breadth in the header
- Colour scale from one to ten percent
- Click through to any symbol's chart and technical scoreboard
Guides that explain it
Market structure
Market breadth
How many stocks share in an index move: the advance-decline line, the percent above the 200-day average, breadth thrusts and divergences.
3 min read
Market structure
Sector rotation
The eleven equity sectors, what each is sensitive to, the classic rotation through the business cycle, and how relative strength shows where money is moving.
3 min read
Market structure
Index points and weighting
How cap-weighted indices work, how a stock's weight times its move becomes basis points and index points, and the Nasdaq 100 and Dow exceptions.
3 min read