Buranku Atlas

Buranku Atlas

The Financial World In One Place

FeaturesLearnMarket hoursPricingSign inStart free with Google
FeaturesLearnMarket hoursPricing
  1. Buranku Atlas
  2. /Features
  3. /Crypto

Crypto

Crypto Markets: The Top 100 Coins by Market Cap With Dominance, Volume and Seven-Day Trend

The top hundred cryptocurrencies by market capitalisation with price, 24-hour and seven-day moves, volume, market cap and Bitcoin dominance, around the clock.
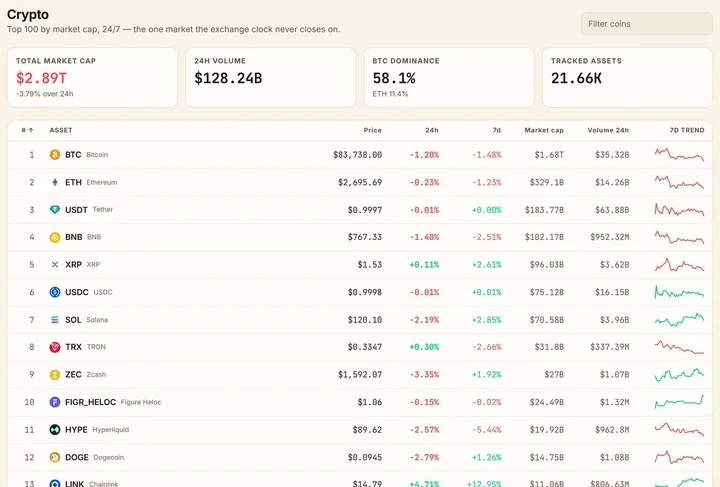
The crypto page with the top hundred by market cap
crypto

The crypto page lists the hundred largest coins by market capitalisation with their price, their move over the last 24 hours and seven days, their 24-hour volume and their market cap, with a sparkline of the week. The total market cap and Bitcoin's share of it, its dominance, sit at the top, with the share held by the next largest coins.

The table sorts on any column and updates around the clock, since the market has no close. Each coin opens a symbol page with its chart and technicals on the same terms as a stock or a currency pair.

Bitcoin also has a notebook of its own, where the desk's weighted-evidence method is applied to it every minute alongside gold, the indices and the currency pairs.

What it shows

  • The top hundred coins by market cap, around the clock
  • Price, 24-hour and seven-day moves, volume and market cap
  • Total market cap and Bitcoin dominance
  • A symbol page for each coin, and a notebook for Bitcoin

On the desk

Crypto

The top hundred by market cap, around the clock, with dominance, volume and seven-day trend.

Open cryptoSign in with Google to look around for free. Subscribe to unlock everything.

Guides that explain it

Market structure

Crypto market cap and dominance

How crypto market cap is computed, what fully diluted valuation adds, what Bitcoin dominance measures and signals, and why 24/7 trading changes the reading.

3 min read

Macro and rates

The VIX explained

How the VIX is derived from S&P 500 option prices, the rule of 16 for a daily move, what its levels and term structure mean, and how it tracks stocks.

4 min read

More of the desk

  • Market 24h clock
  • S&P 500 heatmap
  • Fixed income
  • Economic data
  • Newswire
  • Index Impact
  • Stock Picker
  • Symbol pages
  • Insights
  • Analysis notebooks
  • Market reports
  • Weekly preparation
  • Screener
  • Economic calendar
  • Country indicators
  • Equity
  • Commodities
  • Currencies
  • Markets board
Buranku Atlas

Buranku Atlas

The Financial World In One Place

Market data and news are provided for information only.

Nothing here is financial advice. Indicator readouts are mechanical summaries of price history, not recommendations.

Privacy Policy · Terms of Service

Product

  • Market 24h clock
  • S&P 500 heatmap
  • Fixed income
  • Economic data
  • Newswire
  • Index Impact
  • Stock Picker
  • Symbol pages
  • Insights
  • All features
  • Pricing

Learn

  • EMA 50 and EMA 200
  • RSI explained
  • MACD explained
  • Bollinger Bands
  • Pivot points
  • Yield curve and 2s10s
  • Bond prices and yields
  • Reading the economic calendar
  • The dollar index (DXY)
  • What moves gold
  • All guides

Market hours

  • NYSE hours
  • NASDAQ hours
  • LSE hours
  • XETRA hours
  • EURONEXT hours
  • JPX hours
  • HKEX hours
  • SSE hours
  • NSE hours
  • ASX hours
  • All venues