Rates
Treasury Yield Curve and Bond Market Page: The Curve, Spreads and Yield Indices, Live
The US Treasury par yield curve plotted against the prior close and a month ago, the 2s10s and other spreads, live CBOE yield indices, their history and the bond ETFs that trade them.
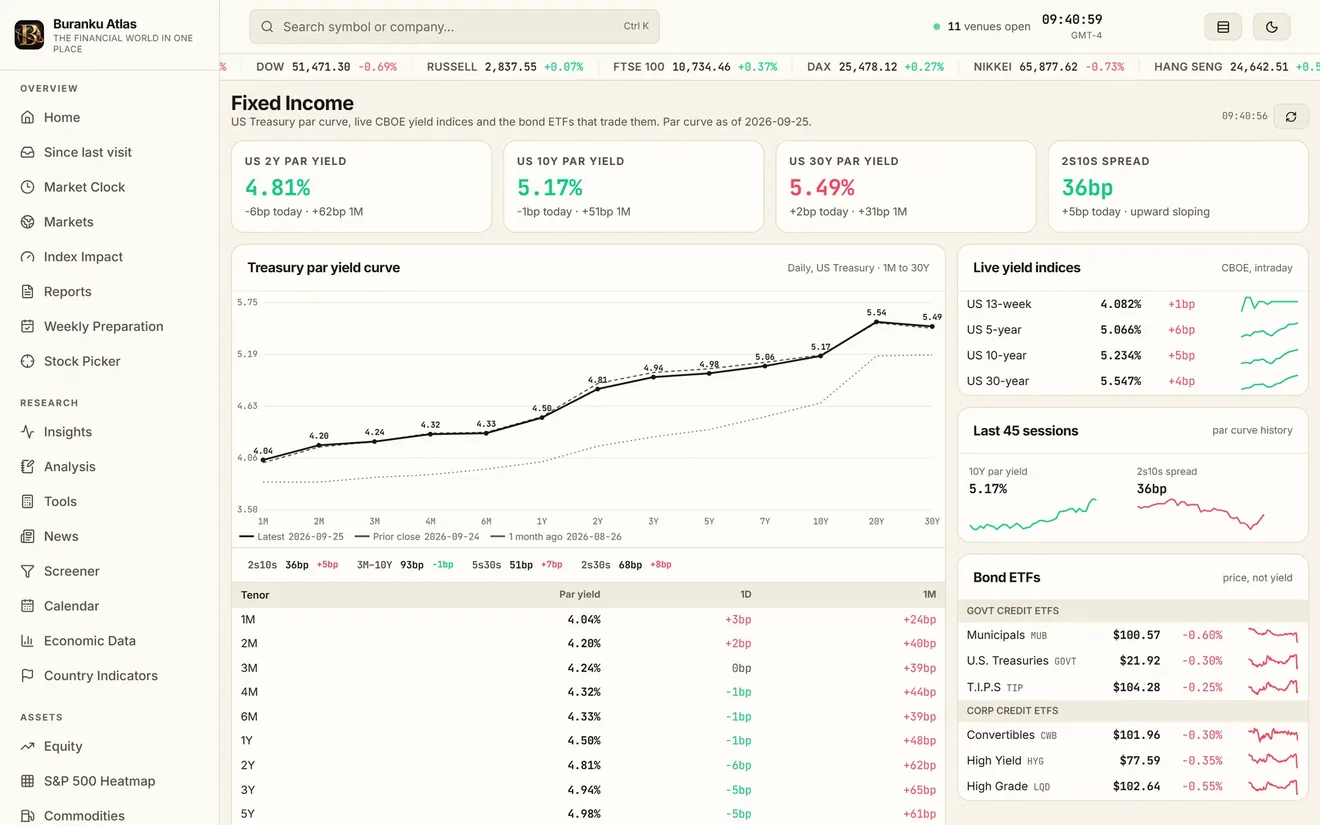
The fixed income page plots the full Treasury par yield curve, from the one-month bill to the thirty-year bond, against the previous close and against the curve a month earlier, so a day's move is read as a change of shape, a steepening or a flattening, rather than as a column of yields. The two-, ten- and thirty-year par yields and the 2s10s spread are quoted beside it, with the daily and monthly change in each.
The live yield indices for the two-, five-, ten- and thirty-year maturities stream through the session, with a chart of the last forty-five sessions for each, so the move in the ten-year since the morning's data can be seen against the weeks before it. Breakeven inflation and the spread between the two- and ten-year are kept alongside.
A table of bond exchange-traded funds, from Treasuries of every maturity to municipals, investment-grade corporates and high yield, translates the yield moves into prices, which is how a portfolio feels them. Each row carries the day's move and links to the fund's own symbol page.
What it shows
- The par curve against the previous close and a month ago
- Two-, ten- and thirty-year yields and the 2s10s spread, with daily and monthly changes
- Live yield indices with forty-five sessions of history
- Treasuries, municipals, corporates and high yield in one ETF table
- Breakeven inflation and the real yield beside the nominal curve
Guides that explain it
Macro and rates
Yield curve and 2s10s
What the Treasury yield curve shows, how the 2s10s spread is computed, what an inversion has meant for recessions, and how a curve steepens or flattens.
4 min read
Macro and rates
Bond prices and yields
Why bond prices fall when yields rise, with a worked example, what duration measures, real yields and breakevens, and why the 10-year Treasury matters.
3 min read