Equities
Global Equity Markets: Benchmarks by Region, US Sectors and Factors, and the S&P 500 at a Glance
The world's equity benchmarks grouped by region with the day's moves, the eleven US sectors and the main factors, movers, and the S&P 500 heatmap in one page.
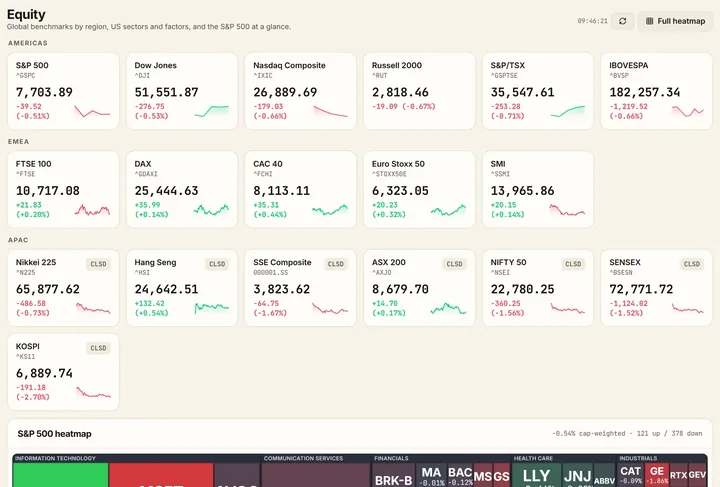
The equity page puts the world's stock markets on one screen. The benchmarks are grouped by region, the Americas, Europe and Asia-Pacific, each with the day's move and a sparkline, so the handover from one session to the next is read from left to right across the page.
For the United States the page adds the eleven sectors with their day, week and month moves, the main factors, growth against value, large against small, high beta against low volatility, and the day's largest movers. A condensed S&P 500 heatmap sits beneath, with a link to the full-screen version.
Every row opens the symbol page for the index, sector or factor fund, with its chart and technicals.
What it shows
- Benchmarks by region with the day's move and a sparkline
- The eleven US sectors over the day, week and month
- Growth, value, size and volatility factors
- The day's movers and a condensed S&P 500 heatmap
Guides that explain it
Market structure
Sector rotation
The eleven equity sectors, what each is sensitive to, the classic rotation through the business cycle, and how relative strength shows where money is moving.
3 min read
Market structure
Market breadth
How many stocks share in an index move: the advance-decline line, the percent above the 200-day average, breadth thrusts and divergences.
3 min read
Market structure
Index points and weighting
How cap-weighted indices work, how a stock's weight times its move becomes basis points and index points, and the Nasdaq 100 and Dow exceptions.
3 min read