Charts
Symbol Pages: Candles, Moving Averages, RSI, MACD, Pivots and a Technical Scoreboard for Any Ticker
A page for any stock, index, currency pair, commodity or coin: candlestick chart with EMA and Bollinger overlays, RSI and MACD panes, pivot points, performance and a bounded technical score.
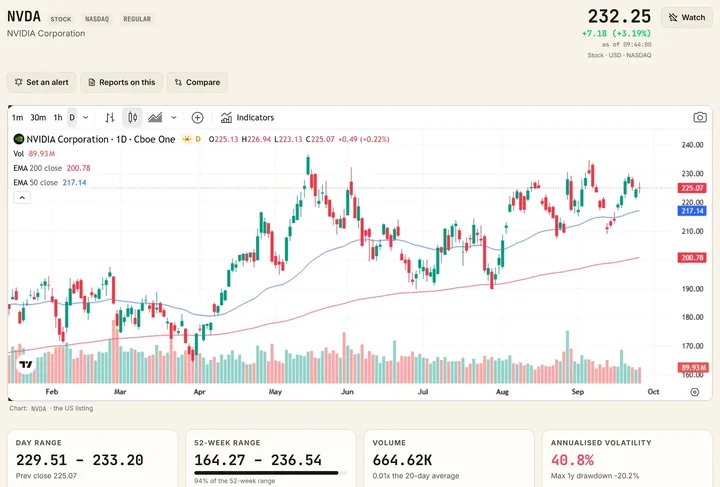
Every instrument on the desk has a symbol page. The chart draws candles on any timeframe from a minute to a month with the 50 and 200 exponential moving averages and Bollinger Bands overlaid, and RSI and MACD in their own panes beneath. The same settings are used on every symbol, so a reading on one chart means the same on another.
A technical scoreboard folds trend, momentum and mean-reversion readings into one bounded score from −100 to +100 and lists the readings behind it: the distance from each moving average, the RSI, the MACD histogram and the position within the bands. The classic pivot point and its three support and resistance levels are computed from the previous session.
Performance over the day, week, month, quarter and year sits beside the 52-week range, and the page is reached from the search bar with a ticker or a name, from any tile on the heatmap, from any row on a board, and from any headline on the wire that names the company.
What it shows
- Candles on any timeframe with EMA 50 and 200 and Bollinger Bands overlaid
- RSI and MACD panes with the standard settings
- A technical score from −100 to +100 with the readings behind it
- Pivot points, performance and the 52-week range
- Stocks, indices, currencies, commodities and crypto on the same page
Guides that explain it
Technical analysis
EMA 50 and EMA 200
How the 50 and 200 exponential moving averages are calculated, what a golden cross and a death cross mean, and how an EMA touch is read across timeframes.
5 min read
Technical analysis
RSI explained
The relative strength index step by step: Wilder's formula, what 70 and 30 mean, why RSI stays overbought in a trend, and how divergence is read.
4 min read
Technical analysis
MACD explained
How MACD is built from two EMAs, what the signal line and histogram add, the three crossovers traders watch, and the cases where MACD misleads.
3 min read
Technical analysis
Bollinger Bands
How Bollinger Bands are built from a 20-period average and two standard deviations, what %B and bandwidth measure, and how the squeeze and band walks are read.
3 min read
Technical analysis
Pivot points
The classic pivot point formula with R1 to R3 and S1 to S3, a worked example, the Fibonacci and Camarilla variants, and which session to compute them from.
4 min read