Overview
Markets Board: Indices, Sectors, Commodities, Currencies and Government Yields by Region on One Screen
One board with the world's benchmarks, US sectors, commodities, currencies and government bond yields, grouped by region, each row with the day's move and a sparkline.
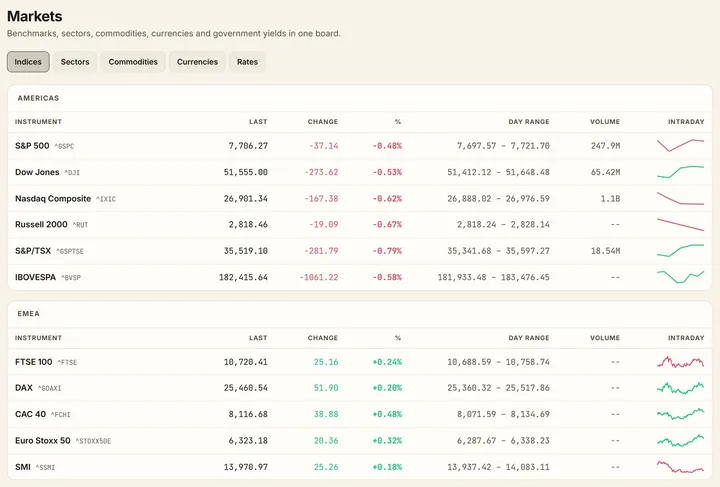
The markets board is the one-screen summary of the tape. Indices, sectors, commodities, currencies and government bond yields are each a section, with the rows grouped by region where that applies, and every row carries the last price, the day's move and a sparkline of the recent sessions.
It is the page to open first in the morning: the overnight session in Asia, the European open and the US futures are read in the first section, the dollar and the yields in the ones beneath, and anything that stands out opens its symbol page with a click.
The board is refreshed through the session, and the same instruments feed the market overview on the home page, the ticker tape and the watchlists.
What it shows
- Indices, sectors, commodities, currencies and yields as sections
- Grouped by region, with the day's move and a sparkline on every row
- Refreshed through the session
- A click opens any instrument's symbol page
Guides that explain it
Market structure
Trading sessions and overlaps
The 24-hour cycle from Wellington to New York, the Asian, European and American sessions in UTC, and why the London–New York overlap carries the volume.
4 min read
Macro and rates
Yield curve and 2s10s
What the Treasury yield curve shows, how the 2s10s spread is computed, what an inversion has meant for recessions, and how a curve steepens or flattens.
4 min read
Market structure
Sector rotation
The eleven equity sectors, what each is sensitive to, the classic rotation through the business cycle, and how relative strength shows where money is moving.
3 min read