Equities · Rates · FX · Commodities · Crypto
Every market. Every release.
One screen.
Buranku Atlas is a market intelligence desk built on mathematics, not opinion. Global benchmarks, the Treasury curve, commodities, currencies and crypto sit beside the economic calendar, a live news wire and a gold analysis re-scored every minute.
Sign in with Google to look around for free. Subscribe to unlock everything. Cancel any time.
- 20
- workspaces on the desk
- 23
- exchanges on the clock
- 500
- S&P constituents mapped
- 5
- asset classes, one tape
01The product
Built for a desk that wants the whole picture.
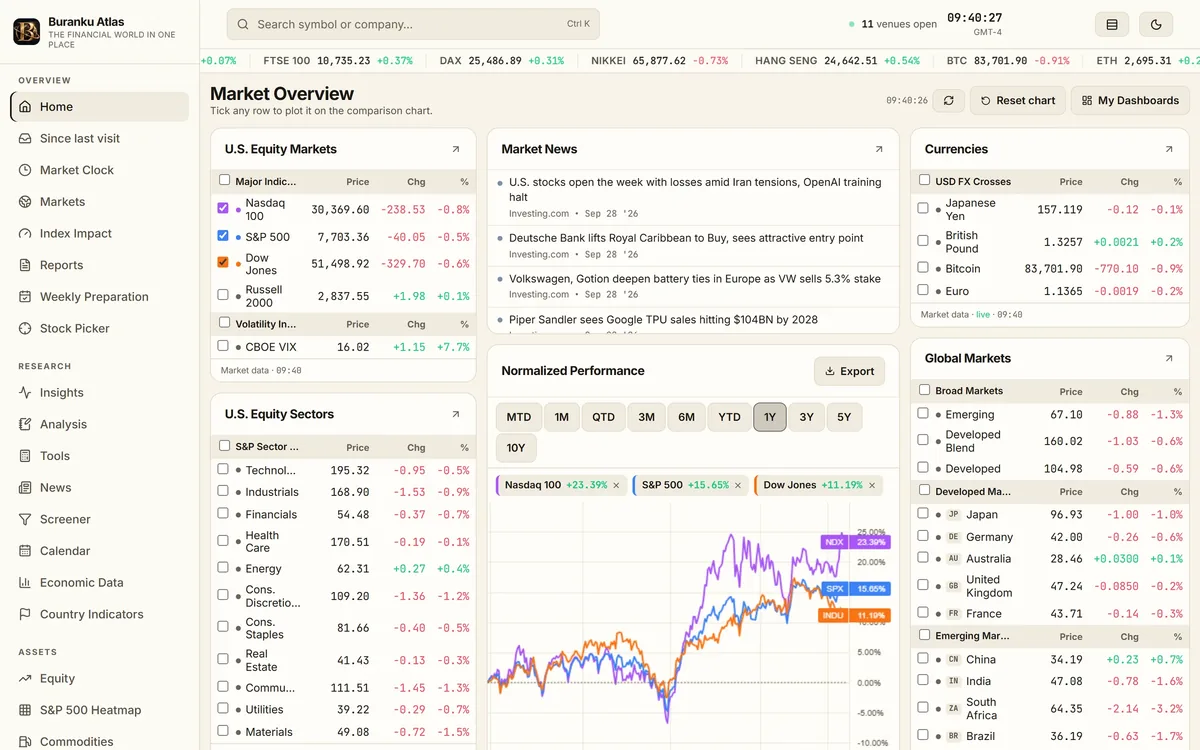
Each workspace is a real page in the product, captured live. Nothing here is a mock-up.
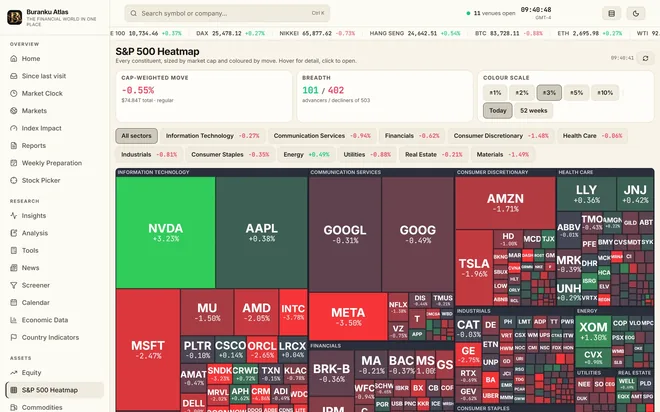
S&P 500 heatmap
The whole index on one canvas.
Every constituent sized by market cap and coloured by its move, grouped by sector, so the shape of the day is obvious before a single number is read.
- Cap-weighted move and breadth for the index at the top
- Sector filters and a switchable colour scale from one to ten percent
- Hover any tile for detail, click through to the full symbol page
Fixed income
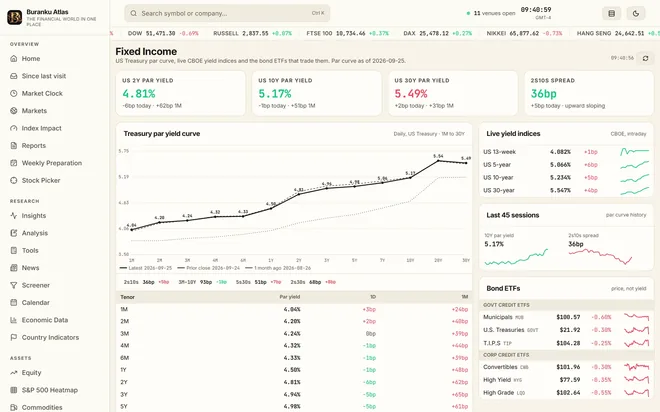
The Treasury curve, live.
The US par curve plotted against the prior close and a month ago, the spreads that matter, and the yield indices and bond ETFs that trade them.
- Two, ten and thirty year par yields with the 2s10s spread
02At a glance
Everything on the desk.
One navigation, one refresh cycle. Open any workspace from the sidebar or jump straight to a ticker with the search bar.
Markets
- Markets board
Benchmarks, sectors, commodities, currencies and yields by region.
- Equity
Global benchmarks, US sectors and factors, the S&P 500 at a glance.
- Crypto
The top hundred by market cap, around the clock.
- Commodities
The GSCI benchmark and front-month futures across metals, energy and agriculture.
- Currencies
Live FX pairs and a converter on ECB reference rates.
- Symbol pages
Candles with EMA and Bollinger overlays, RSI and MACD, a technical scoreboard.
- Country indicators
Every series a country reports, 218 countries, back to 1960.
Analysis
- Market 24h clock
Every exchange a ring, every session an arc, on one dial.
- Insights
A cross-asset regime read, breadth, rotation and technical scores.
- Analysis notebooks
Daily reads for gold, indices, energy, FX and sectors, each with a verdict.
03The method
The math behind every read.
Nothing on the desk is a feeling. Each verdict is a weighted sum you can audit, each range is measured volatility, and every call is scored against the tape from the moment it is published.
SCORE = Σ wᵢ · sᵢ
w = weight of the release · s = −1, 0, +1
Weighted evidence
Every release and every market check carries a weight. The read is the sum, capped by family so one theme cannot shout down the rest.
04Desk plan
The Stock Picker and portfolio management.
The desk's analysts publish their trades: the instrument, the side, the entry, the target and the stop, with the reasoning. Every pick is scored from its entry until the desk closes it, so the record is there to read, not to take on trust.
- Entry, target and stop on every pick, with the reward-to-risk computed from them
- Live distance from the current price to each level, refreshed every minute
- Open picks and the closed record, hit rate and average move included
- Portfolio management: ask for a review and the desk's read of your book appears on your portfolio page
- Direct access to the desk on entries, levels and timing
Included with Desk. Standard subscribers can switch any time.
How every pick is laid out
Desk plan- Instrument and side
- The stock, index, currency or commodity, and whether the desk is long or short.
- Entry
- The level the trade is taken at; the record is scored from here.
05Pricing
One desk, one subscription.
Billed monthly, or yearly at a saving. Cancel any time. Access opens the moment the payment goes through.
Standard
The full terminal, for one desk.
€49.99/ month
EUR, billed monthly. Cancel any time.
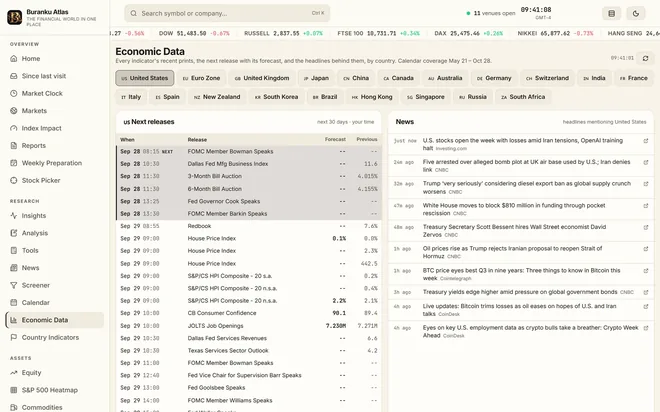
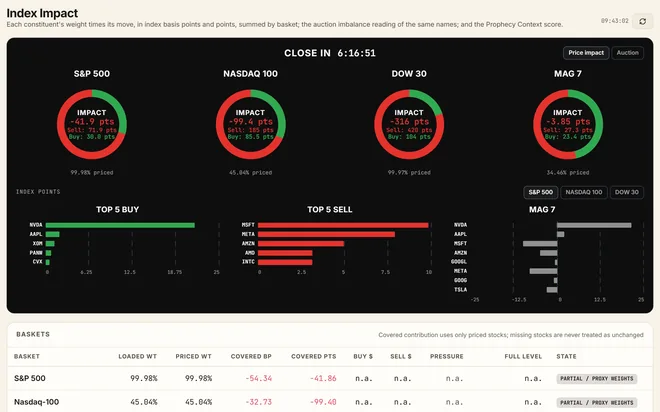
- Every market page: clock, markets, index impact, insights, screener, calendar, economic data
- The daily analysis notebooks as a read, refreshed every minute
- Watchlists, portfolio, dashboards and alerts, synced to your account
- Published research from the desk
Desk
Most supportThe best analysts for the best entries.
€99.99/ month
EUR, billed monthly. Cancel any time.
- Everything in Standard
- Stock Picker: the analysts' trades with entry, target and stop, scored as they play out
06How it works
A private desk, for subscribers.
Buranku Atlas is not a public site. The desk opens to paying subscribers the moment their payment goes through, and nothing about you is stored beyond the Google identity you sign in with and what Stripe reports about your subscription.
- 1
Sign in with Google
No passwords to manage. Your Google account is the identity, and nothing else is asked for. Every page opens as a free preview.
- 2
Choose a plan
Pay on a secure checkout page and the desk opens the moment the payment goes through. Nothing is reviewed by hand, and you can cancel from your account page at any time.
- 3
Your desk follows you
Watchlists, portfolio, alerts and dashboards are saved to your account and appear on every device you sign in from.
Google sign-in · Instant access on payment · Live streaming prices
07Questions
Before you sign in.
More in the guides and the market hours.
- What is Buranku Atlas?
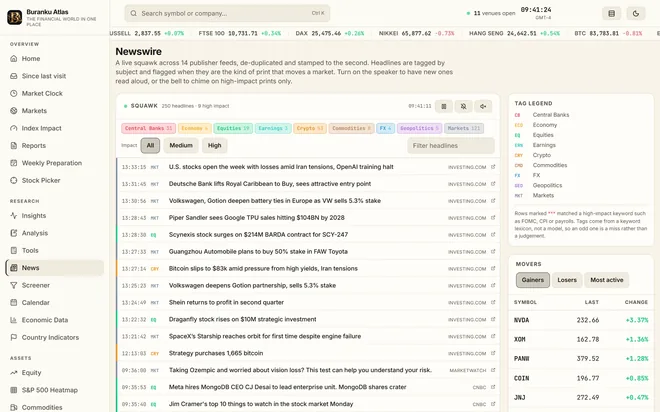
- A market intelligence desk in the browser: live prices for stocks, indices, currencies, commodities, bonds and crypto, a 24-hour market clock, the economic calendar, a news wire, an S&P 500 heatmap, the Treasury yield curve and daily analysis notebooks, with watchlists, a portfolio, alerts and dashboards saved to your account.
- Which markets does it cover?
- Equities on 23 exchanges from New York to Tokyo, US sectors and factors, the S&P 500 constituent by constituent, government bond yields, the major currency pairs, energy, metals and agricultural futures, and the top hundred cryptocurrencies by market cap.
- Is there a free plan?
- Yes. Sign in with Google and every page opens as a free preview on data as it stood a year ago, so you can see exactly what the desk has. A subscription opens the live desk the moment the payment goes through.
- What does a subscription cost?
- Two plans, billed monthly and cancellable at any time from your account page. Standard is the whole terminal; Desk adds the Stock Picker, portfolio management and direct access to the desk's analysts. The prices are on the pricing page and confirmed at checkout.
- Is this financial advice?
- No. Everything on the desk is market data, news and mechanical analysis of price history and scheduled releases, provided for information. Indicator readouts and notebook verdicts are weighted sums you can audit, not recommendations.
- What is the Market 24h Clock?
- A single 24-hour dial on which each of 23 stock exchanges is a ring and each of its sessions an arc, redrawn in any time zone, with the hand showing what is trading right now and a scrubber for any hour of any day. The market-hours pages on this site list every venue's hours.
Get started
Put the financial world in one place.
Sign in, subscribe, and open the desk from any browser. No installs, nothing to configure.