Buranku Atlas

Buranku Atlas

The Financial World In One Place

FeaturesLearnMarket hoursPricingSign inStart free with Google
FeaturesLearnMarket hoursPricing
  1. Buranku Atlas
  2. /Features
  3. /Weekly preparation

Research

Weekly Preparation: The Trading Week Ahead, Day by Day, With Levels and the Reads as They Stand

The desk's plan for the week: the releases that matter on each day, the levels going into the week, the notebooks' reads as they stand, and what would change the plan.
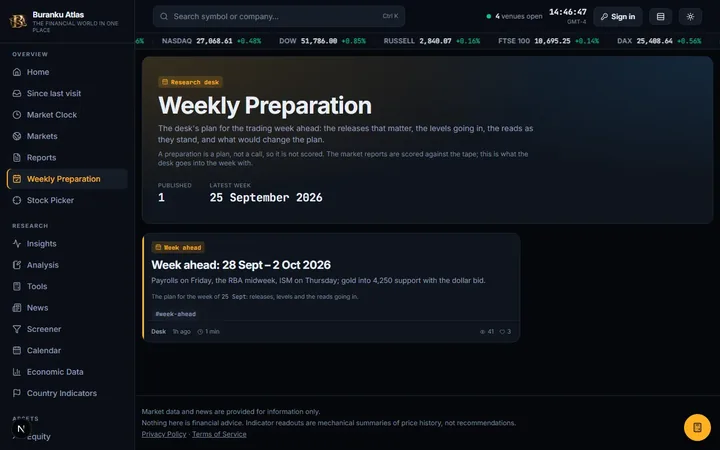
The weekly preparation page with the week's releases day by day
weekly

The weekly preparation page is written before the week begins. It lays out, day by day, the releases and events that are likely to move markets, from the central bank meetings and the inflation and jobs prints to the earnings that matter for the indices, with the times in your zone.

Beside the calendar it records the levels the desk is watching going into the week for each of its instruments and the notebooks' reads as they stand on Sunday, so that the week's moves can be judged against a plan that was written down first.

The last section says what would change the plan: the prints or price levels that would turn a read, so that when they arrive the response has already been thought through.

What it shows

  • The week's releases and events, day by day, in your time zone
  • The levels going into the week for every instrument
  • The notebooks' reads as they stand before the open
  • What would change the plan

On the desk

Weekly preparation

The desk's plan for the trading week ahead: the releases that matter day by day, the levels going in, the reads as they stand, and what would change the plan.

Open the week aheadSign in with Google to look around for free. Subscribe to unlock everything.

Guides that explain it

Macro and rates

Reading the economic calendar

What actual, forecast and previous mean, why the surprise moves markets rather than the level, and the US and European releases that matter most.

4 min read

Market structure

Trading sessions and overlaps

The 24-hour cycle from Wellington to New York, the Asian, European and American sessions in UTC, and why the London–New York overlap carries the volume.

4 min read

Technical analysis

Pivot points

The classic pivot point formula with R1 to R3 and S1 to S3, a worked example, the Fibonacci and Camarilla variants, and which session to compute them from.

4 min read

More of the desk

  • Market 24h clock
  • S&P 500 heatmap
  • Fixed income
  • Economic data
  • Newswire
  • Index Impact
  • Stock Picker
  • Symbol pages
  • Insights
  • Analysis notebooks
  • Market reports
  • Screener
  • Economic calendar
  • Country indicators
  • Equity
  • Crypto
  • Commodities
  • Currencies
  • Markets board
Buranku Atlas

Buranku Atlas

The Financial World In One Place

Market data and news are provided for information only.

Nothing here is financial advice. Indicator readouts are mechanical summaries of price history, not recommendations.

Privacy Policy · Terms of Service

Product

  • Market 24h clock
  • S&P 500 heatmap
  • Fixed income
  • Economic data
  • Newswire
  • Index Impact
  • Stock Picker
  • Symbol pages
  • Insights
  • All features
  • Pricing

Learn

  • EMA 50 and EMA 200
  • RSI explained
  • MACD explained
  • Bollinger Bands
  • Pivot points
  • Yield curve and 2s10s
  • Bond prices and yields
  • Reading the economic calendar
  • The dollar index (DXY)
  • What moves gold
  • All guides

Market hours

  • NYSE hours
  • NASDAQ hours
  • LSE hours
  • XETRA hours
  • EURONEXT hours
  • JPX hours
  • HKEX hours
  • SSE hours
  • NSE hours
  • ASX hours
  • All venues