Macro
Economic Calendar: This Week's Releases by Country With Impact, Actual, Forecast and Previous in Your Time Zone
The economic calendar from yesterday to next week with country flags, impact stars, actual, forecast and previous, local, GMT and remaining times, filters, earnings and venue sessions.
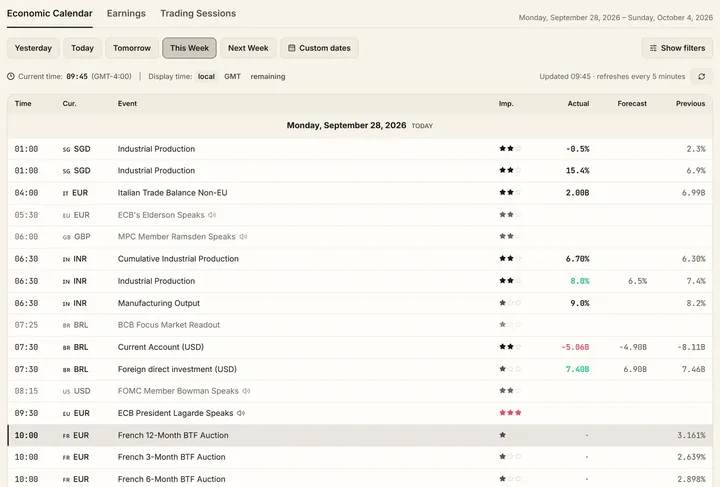
The economic calendar lists every scheduled release from yesterday to next week, or over any range you set, with the country's flag, its impact rating, and the actual, forecast and previous values on one line. Times are shown in your zone or in GMT, with the hours and minutes remaining until each print, so the day's schedule needs no conversion.
Filters by country, by importance and by indicator reduce the week to the releases that matter for your instruments, and the calendar keeps the actual values as they print, so the day's surprises are visible in the same table they were anticipated in.
Beside the releases, the calendar carries the week's earnings reports and the trading sessions of every venue, so a print, a report and the market it lands in can be read together.
What it shows
- Releases by country from yesterday to next week, or any range
- Impact rating, actual, forecast and previous on every line
- Local, GMT and remaining times
- Filters by country, importance and indicator
- Earnings and venue sessions alongside
Guides that explain it
Macro and rates
Reading the economic calendar
What actual, forecast and previous mean, why the surprise moves markets rather than the level, and the US and European releases that matter most.
4 min read
Market structure
Trading sessions and overlaps
The 24-hour cycle from Wellington to New York, the Asian, European and American sessions in UTC, and why the London–New York overlap carries the volume.
4 min read
Macro and rates
Yield curve and 2s10s
What the Treasury yield curve shows, how the 2s10s spread is computed, what an inversion has meant for recessions, and how a curve steepens or flattens.
4 min read