Macro
Economic Data by Country: Every Indicator's History, Next Release and the News Behind It
For the United States, the euro zone, the United Kingdom, Japan, China and more: each indicator's recent prints, the next release with its consensus, and the news wire filtered to that country.
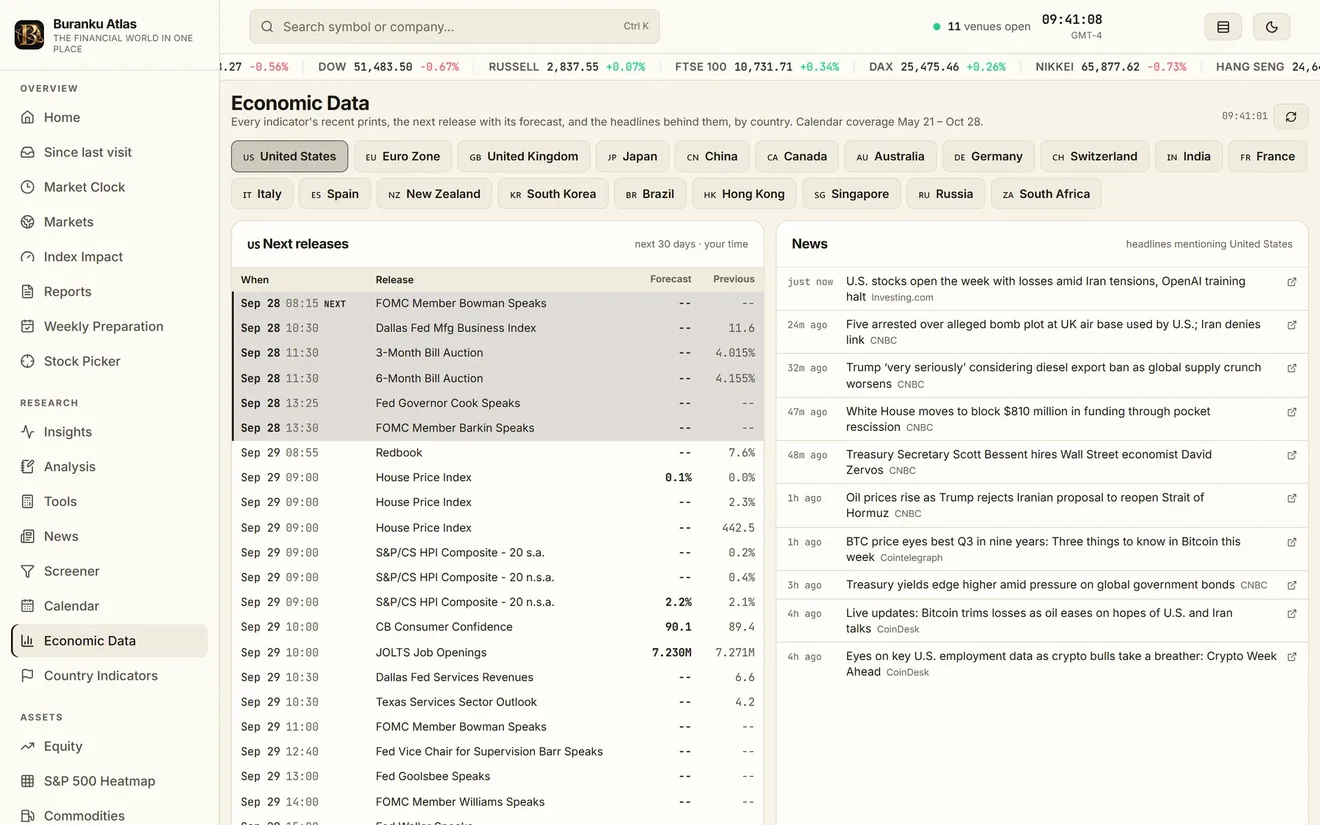
The economy page is organised by country. For each, every indicator the desk tracks is listed with its last prints, so the trend in inflation, employment, growth and the purchasing managers' surveys is read as a short history rather than as one number. The next scheduled release of each indicator is shown with its consensus forecast and the previous value, which is what the market will measure it against.
Beneath the indicators, the news wire is filtered to the country in view, so the headlines that explain a print or anticipate the next one sit on the same page. The combination answers the two questions a release day raises: what was expected, and what has been said since.
The countries covered include the United States, the euro zone, the United Kingdom, Japan, China, Canada, Australia and Switzerland, and the same indicators are kept for each so that a comparison across countries uses the same terms.
What it shows
- Every tracked indicator's recent prints, per country
- The next release with consensus and previous, side by side
- The news wire filtered to the country in view
- The United States, the euro zone, the United Kingdom, Japan, China and more
Guides that explain it
Macro and rates
Reading the economic calendar
What actual, forecast and previous mean, why the surprise moves markets rather than the level, and the US and European releases that matter most.
4 min read
Macro and rates
Yield curve and 2s10s
What the Treasury yield curve shows, how the 2s10s spread is computed, what an inversion has meant for recessions, and how a curve steepens or flattens.
4 min read
Macro and rates
The dollar index (DXY)
How the US Dollar Index is built from six currencies, its weights and history, what it leaves out, and why its moves run through gold, oil and emerging markets.
3 min read