Equities
Stock Screener and EMA Touch Boards: Filter Large Caps Live and Map Every S&P 500 Stock Against Its EMA 50 and 200
Filter a large-cap universe on live session data by change, volume, 52-week position and intraday trend, and see every analysis asset and S&P 500 member against its EMA 50 and 200 on four timeframes.
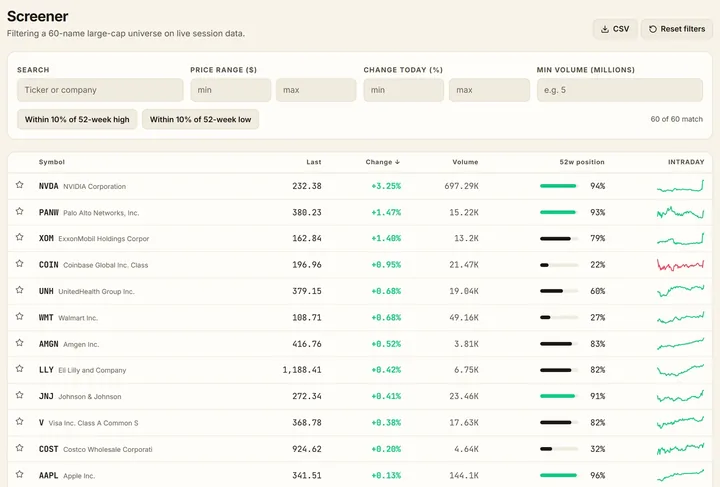
The screener filters a universe of large-cap stocks on the session's live data: the day's change, volume against its average, the position within the 52-week range and the intraday trend. The columns sort, the filters combine, and a result opens the symbol page with the chart and technicals.
The EMA Touch boards are the screener's second half. The first maps every asset the desk analyses against its 50 and 200 exponential moving averages on the 30-minute, one-hour, four-hour and daily charts and flags a touch of either average on any of them. The second does the same for every S&P 500 member, grouped by sector, on the four-hour and daily charts, computed in a slow pass on the server so that the whole index is covered without waiting.
A touch is listed with the distance from the average, the slope of the average and the timeframe, and each row opens a chart with the 200 EMA drawn so that the touch can be seen rather than inferred.
What it shows
- A large-cap universe filtered on change, volume, 52-week position and intraday trend
- EMA Touch for every analysis asset on 30-minute, one-hour, four-hour and daily charts
- EMA S&P 500: every member by sector against its 50 and 200 on four-hour and daily charts
- Each row opens a chart with the averages drawn
Guides that explain it
Technical analysis
EMA 50 and EMA 200
How the 50 and 200 exponential moving averages are calculated, what a golden cross and a death cross mean, and how an EMA touch is read across timeframes.
5 min read
Market structure
Market breadth
How many stocks share in an index move: the advance-decline line, the percent above the 200-day average, breadth thrusts and divergences.
3 min read
Technical analysis
RSI explained
The relative strength index step by step: Wilder's formula, what 70 and 30 mean, why RSI stays overbought in a trend, and how divergence is read.
4 min read